Smart Analytics in Fairways Debt enables you to monitor and analyze your debt, and make decisions, using key indicators.
Prerequisite
Contact your Finance Active consultant to:
View Dashboards
- Log in to your Fairways Debt account and select a customer account, if relevant.
- Navigate to Applications
 > Analytics.
 - Select a dashboard.
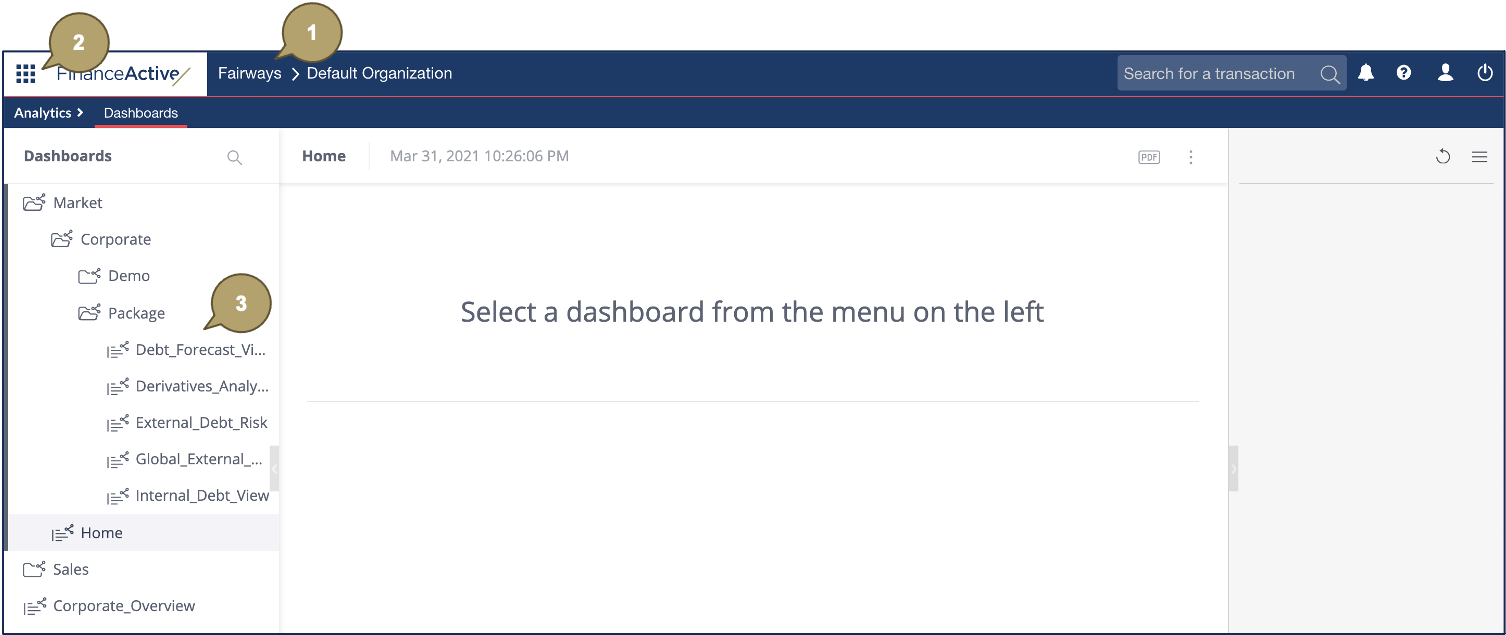
The selected dashboard displays.
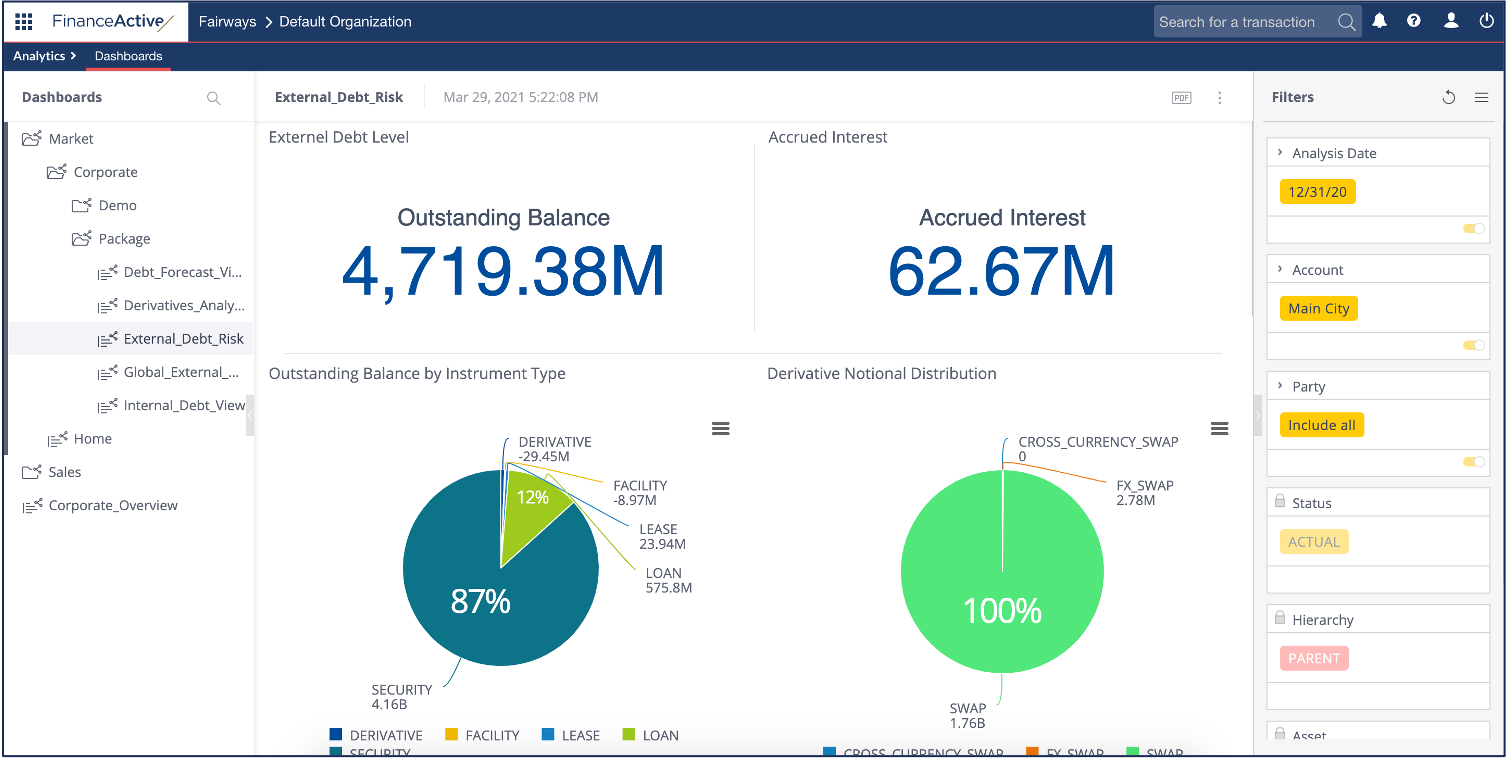
In this example, we are viewing the External Debt Risk dashboard.
|
# |
Description |
|---|---|
|
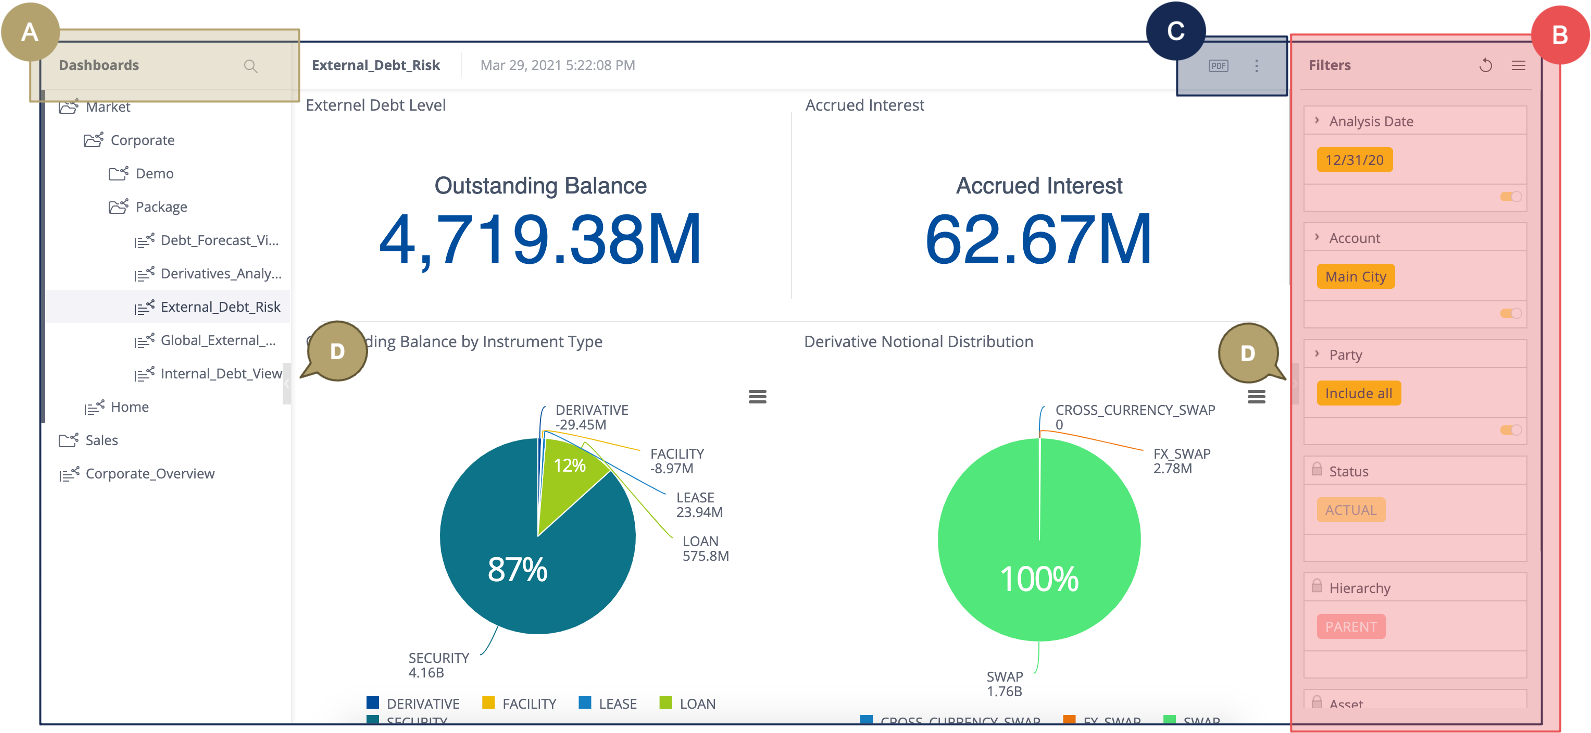
A |
Search for a dashboard. |
|
B |
Filter the data to display. |
|
C |
Export the dashboard to another format, e.g. PDF. |
|
D |
Expand/Reduce the side menus. |
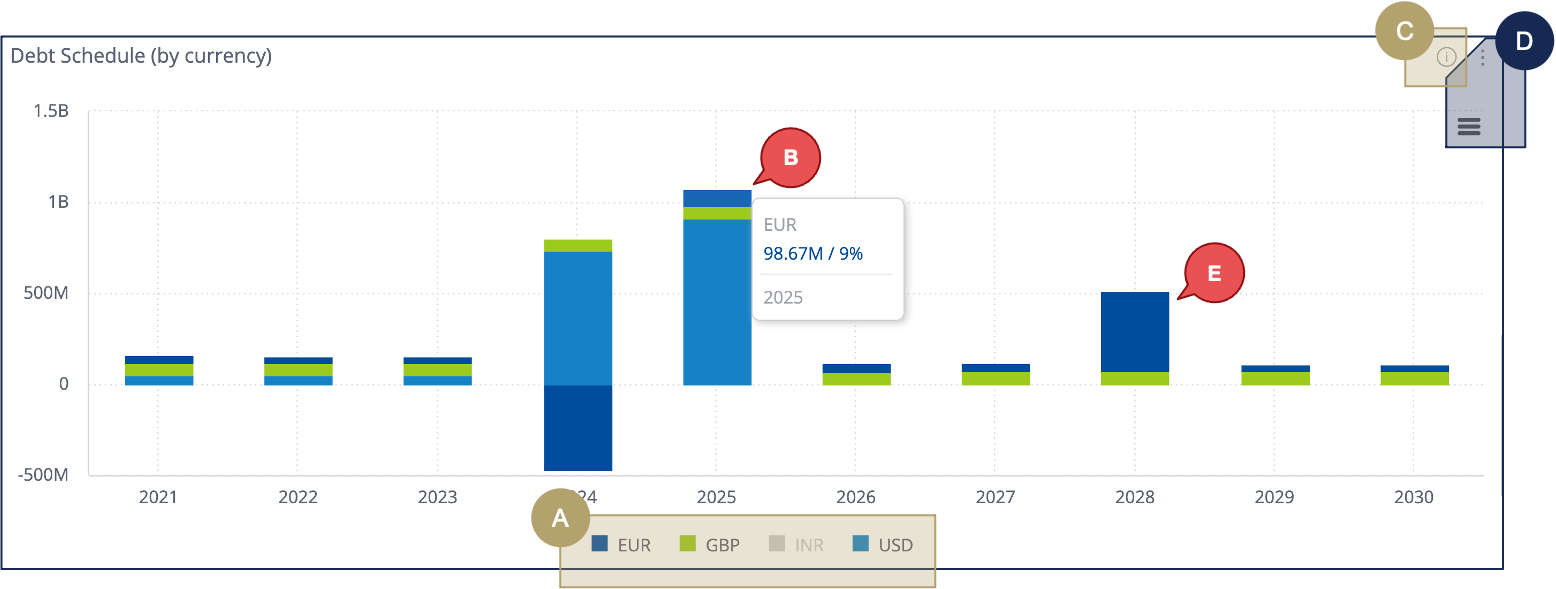
In this example, we are viewing the Debt Schedule (by currency) widget.
|
# |
Description |
|---|---|
|
A |
Filter the data to display:
|
|
B |
Hover over a data to display its details. |
|
C |
Display and refresh the actual analysis date and hour. |
|
D |
Export a specific widget to another format, e.g. PDF. |
|
E |
Right-click and drill down the data for a specific time period. |