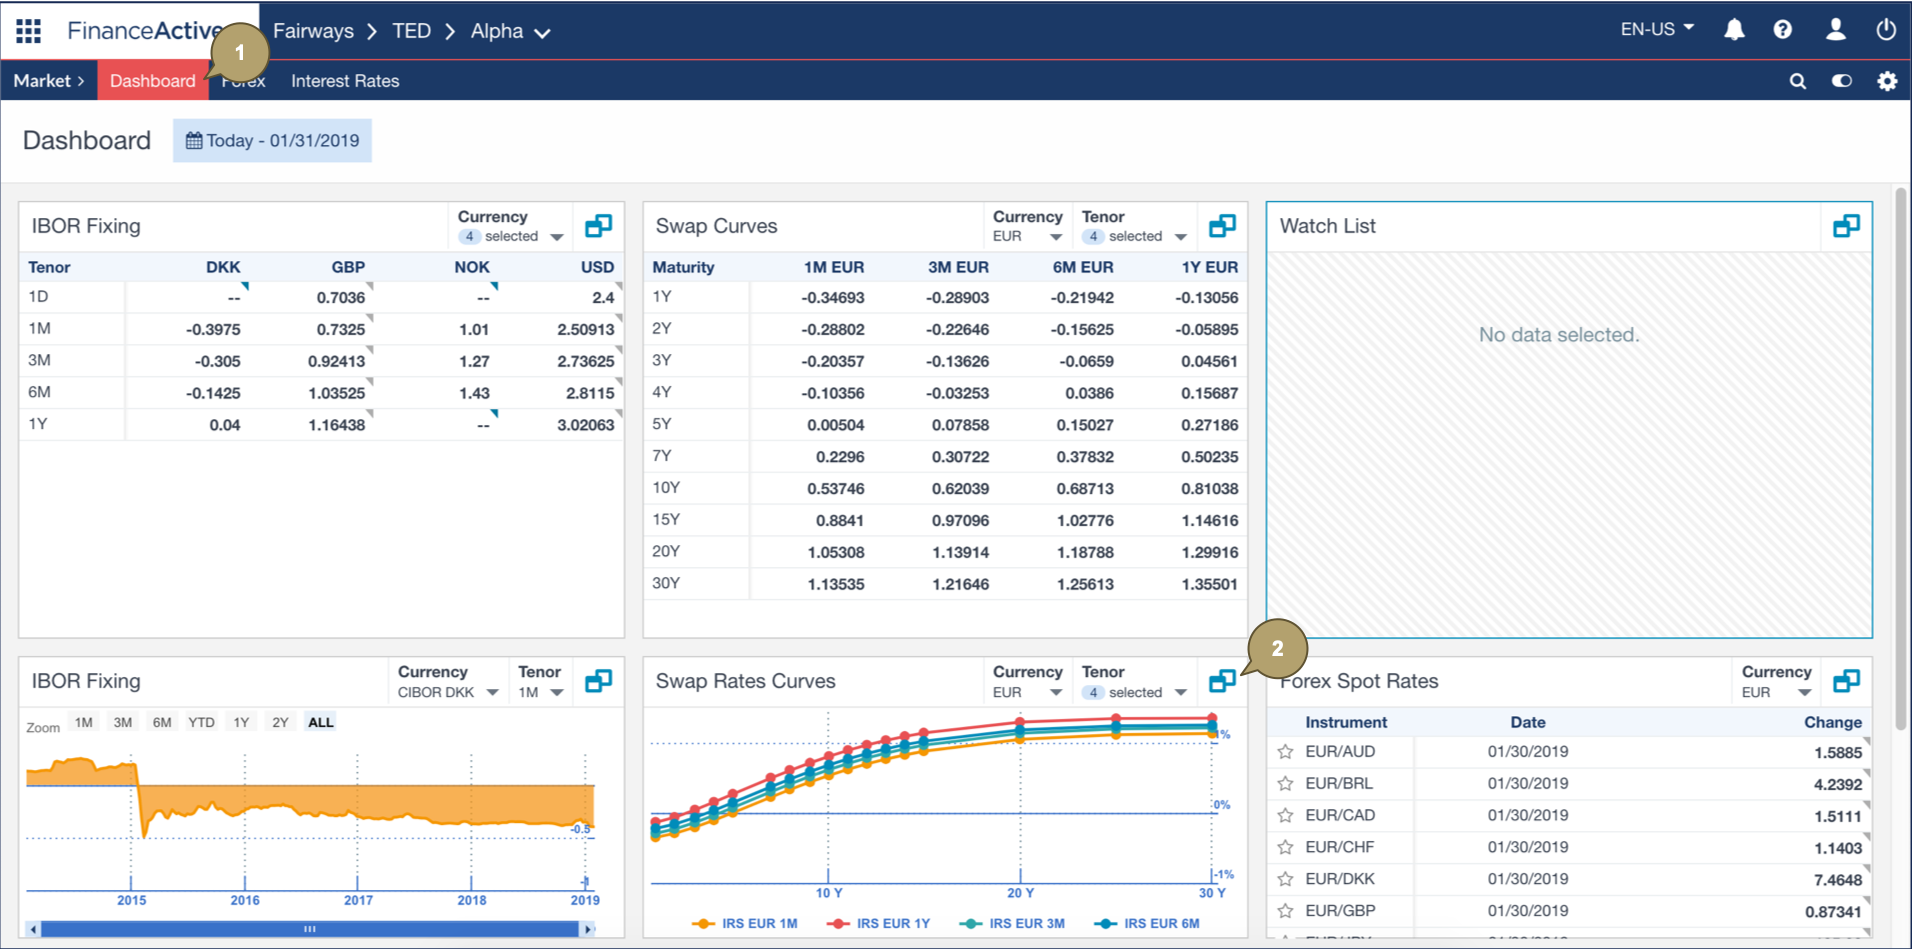
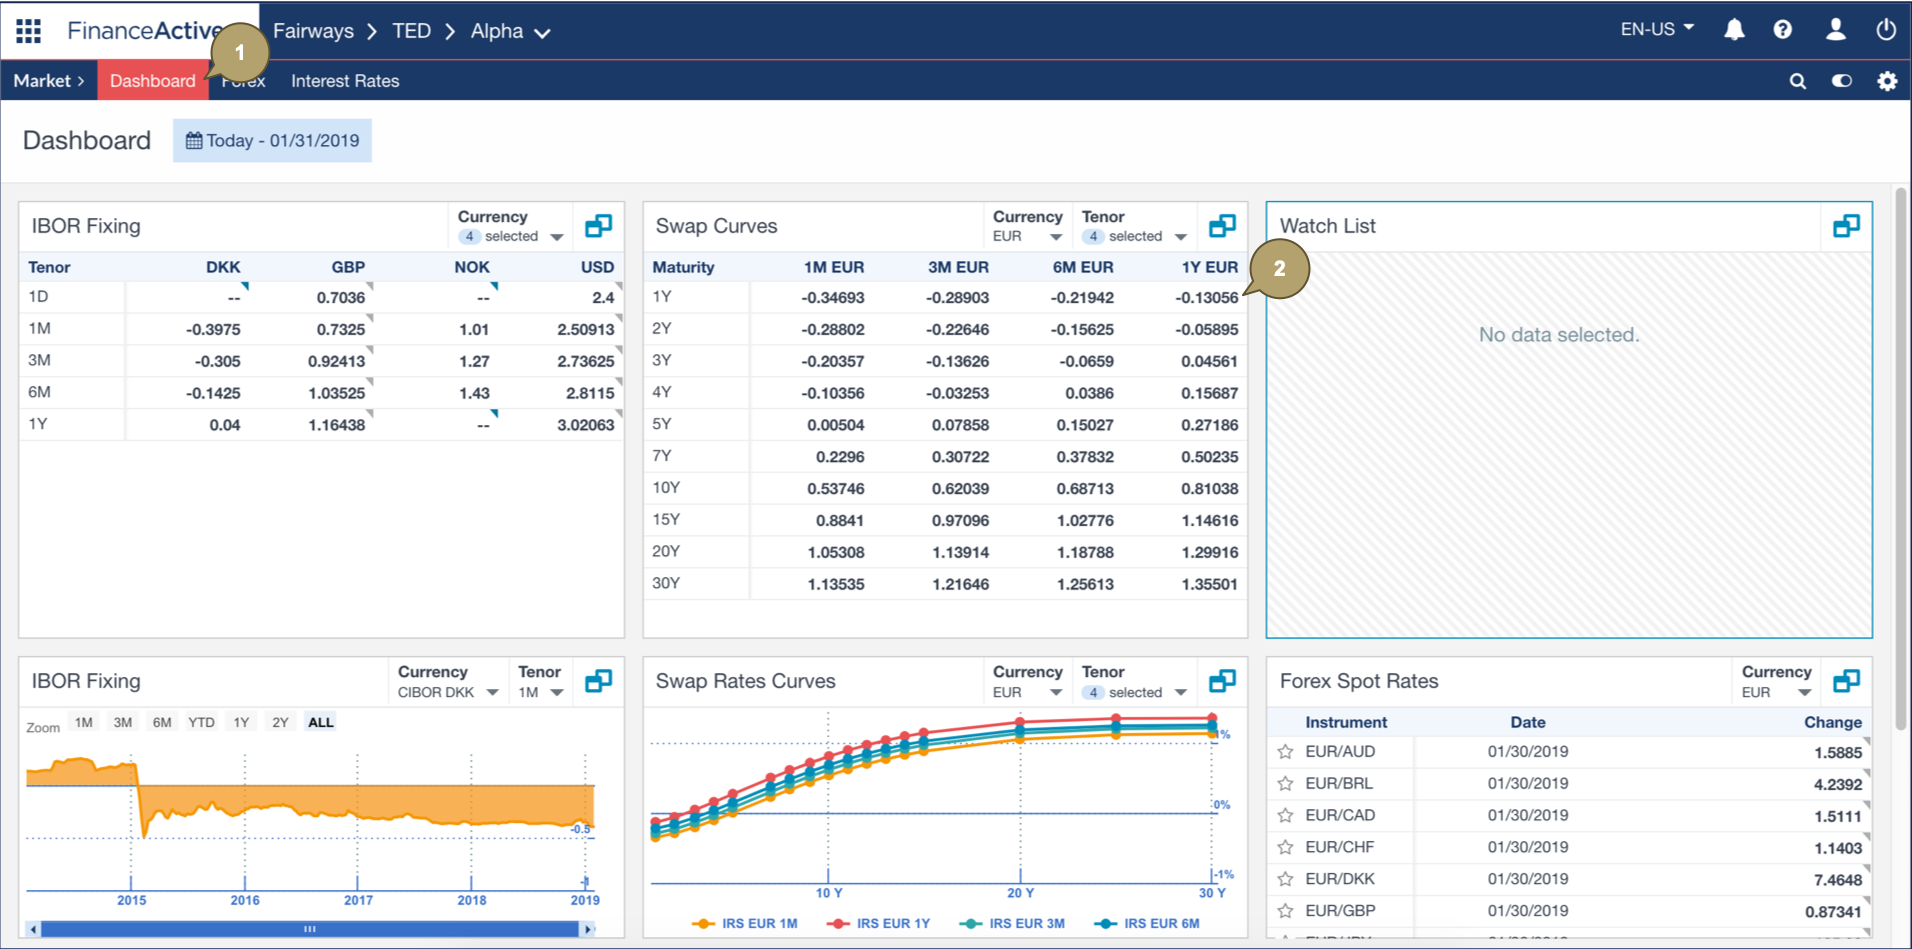
The Swap Rate Curves graph and table show the fixing values of the swap rates for a specific currency, on a specific market date.
Navigate to the Market Application
- Log in to your Fairways Debt account.
- Select a customer account.
- Navigate to Applications
 > Market.
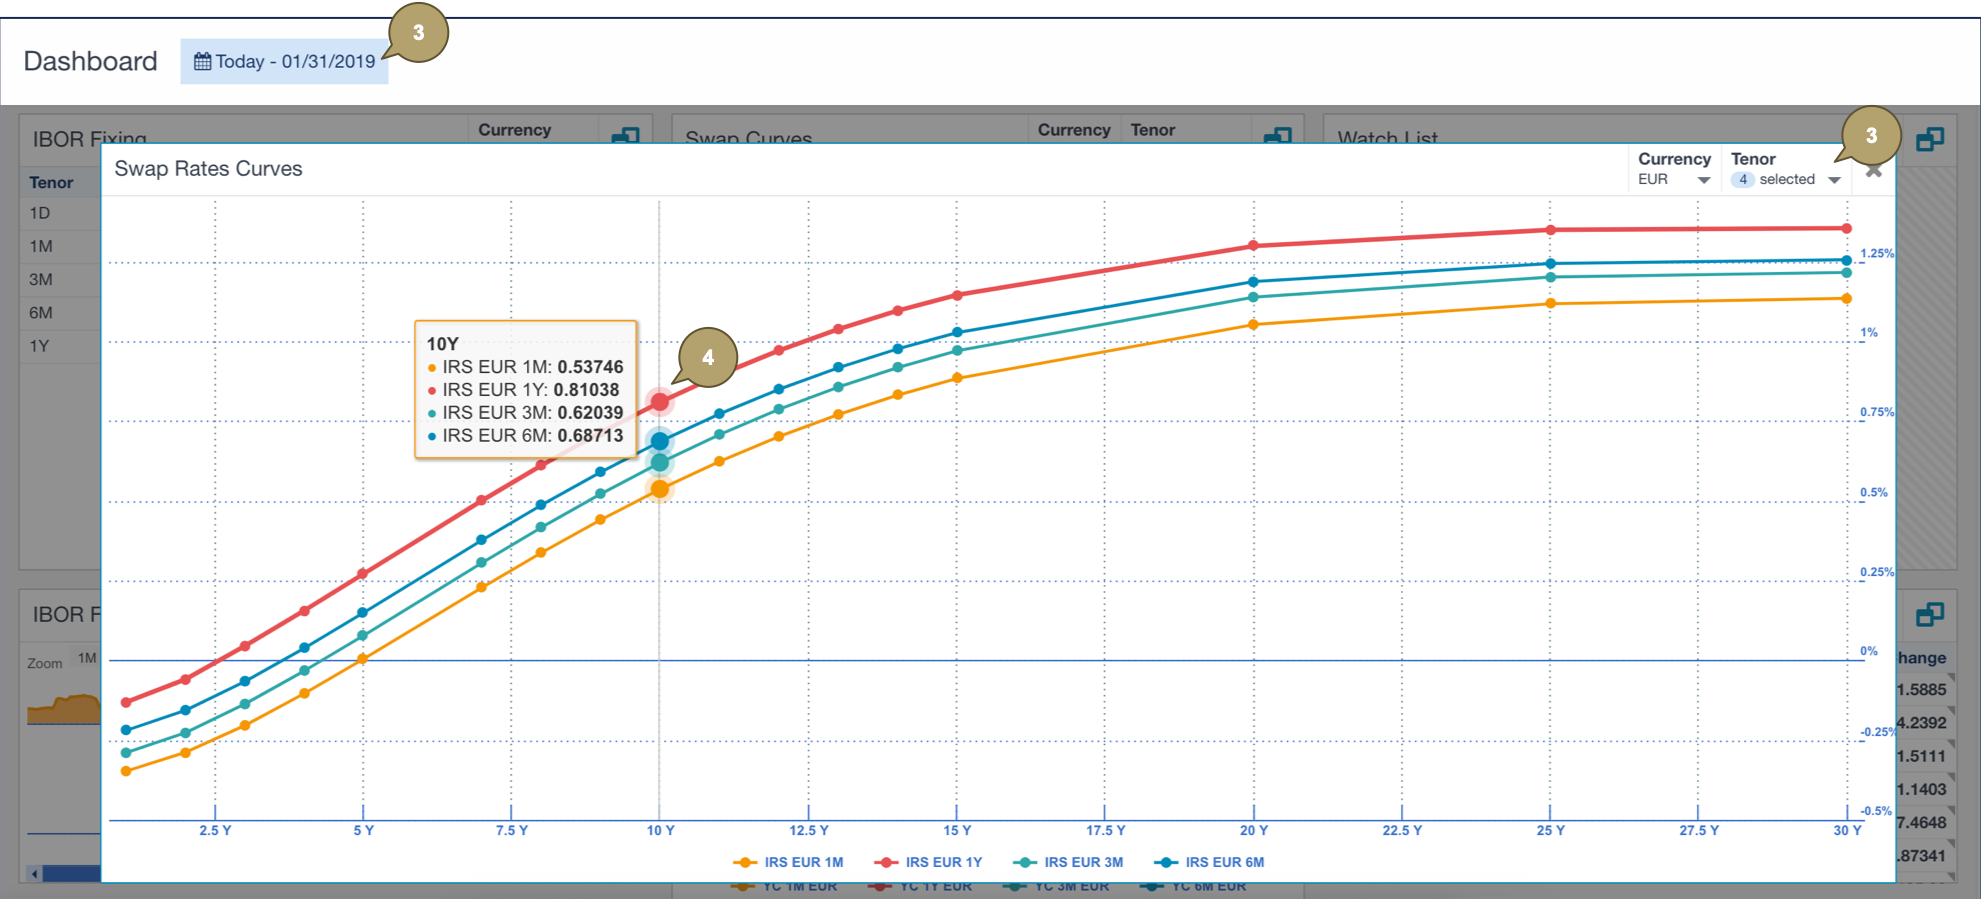
View the Swap Rate Curves Graph
- Navigate to Dashboard.
- Click Enlarge
 beside the Swap Rate Curves panel to display a larger graph.
- Edit the market date, currency and tenor(s) to display relevant data.
- Hover over a marker to display the accurate discount factor(s).
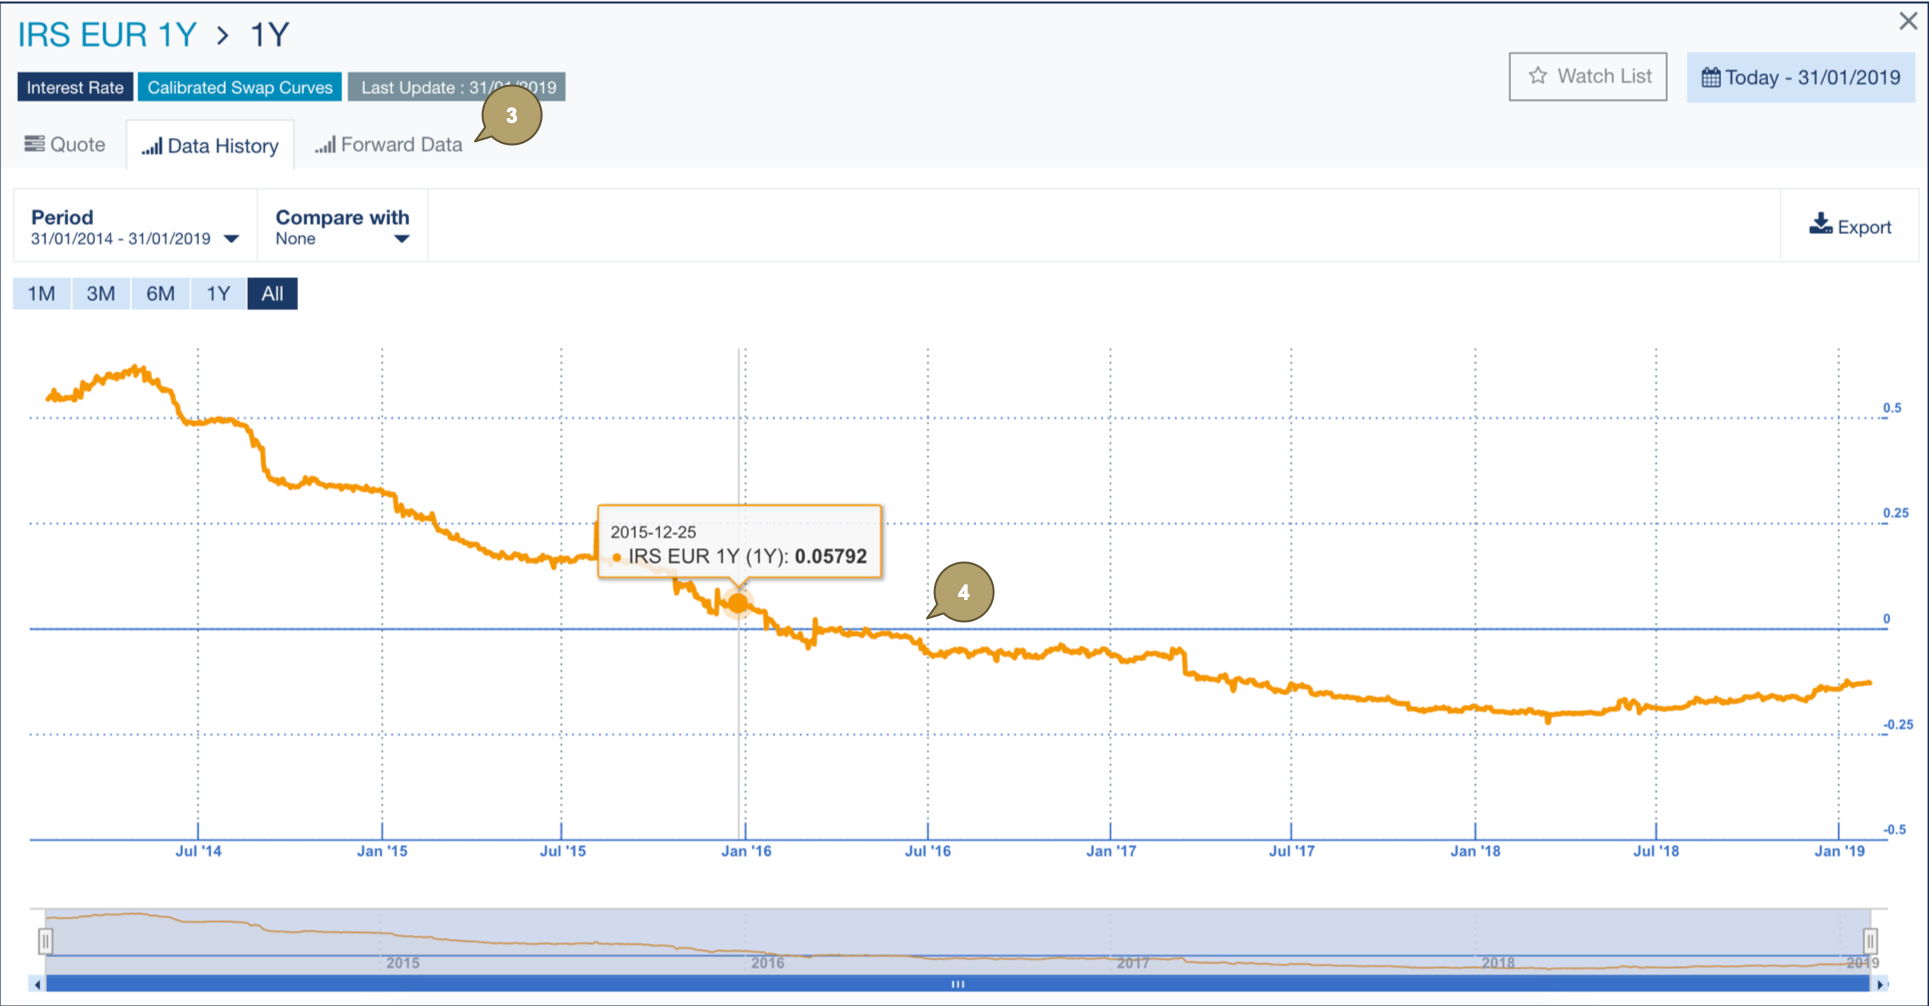
View the Swap Curves Table
- Navigate to Dashboard.
- Click a value in the Swap Curves panel to view its details.
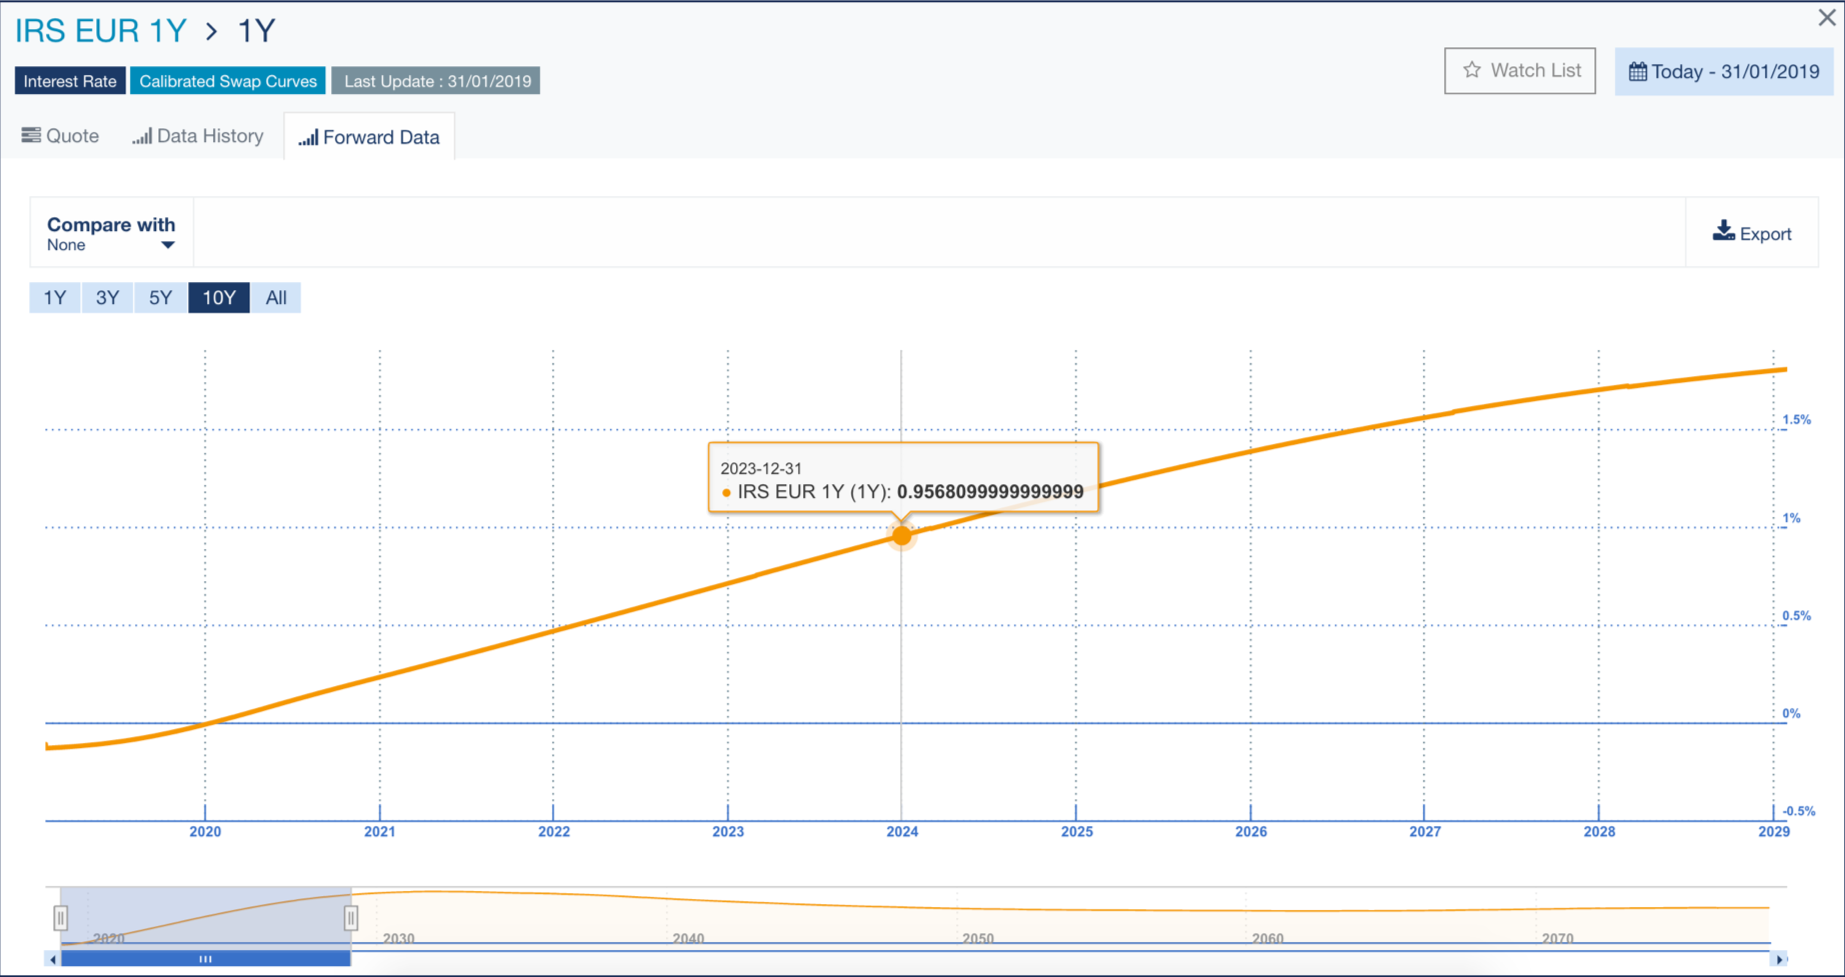
- Click:
- Data History to view a timeline chart showing the fixing history for the selected swap rate and maturity, up to the market date.
- Forward Data to view a timeline chart showing the forward swap rate curve for the selected maturity.
- Hover over a marker to display the accurate data.