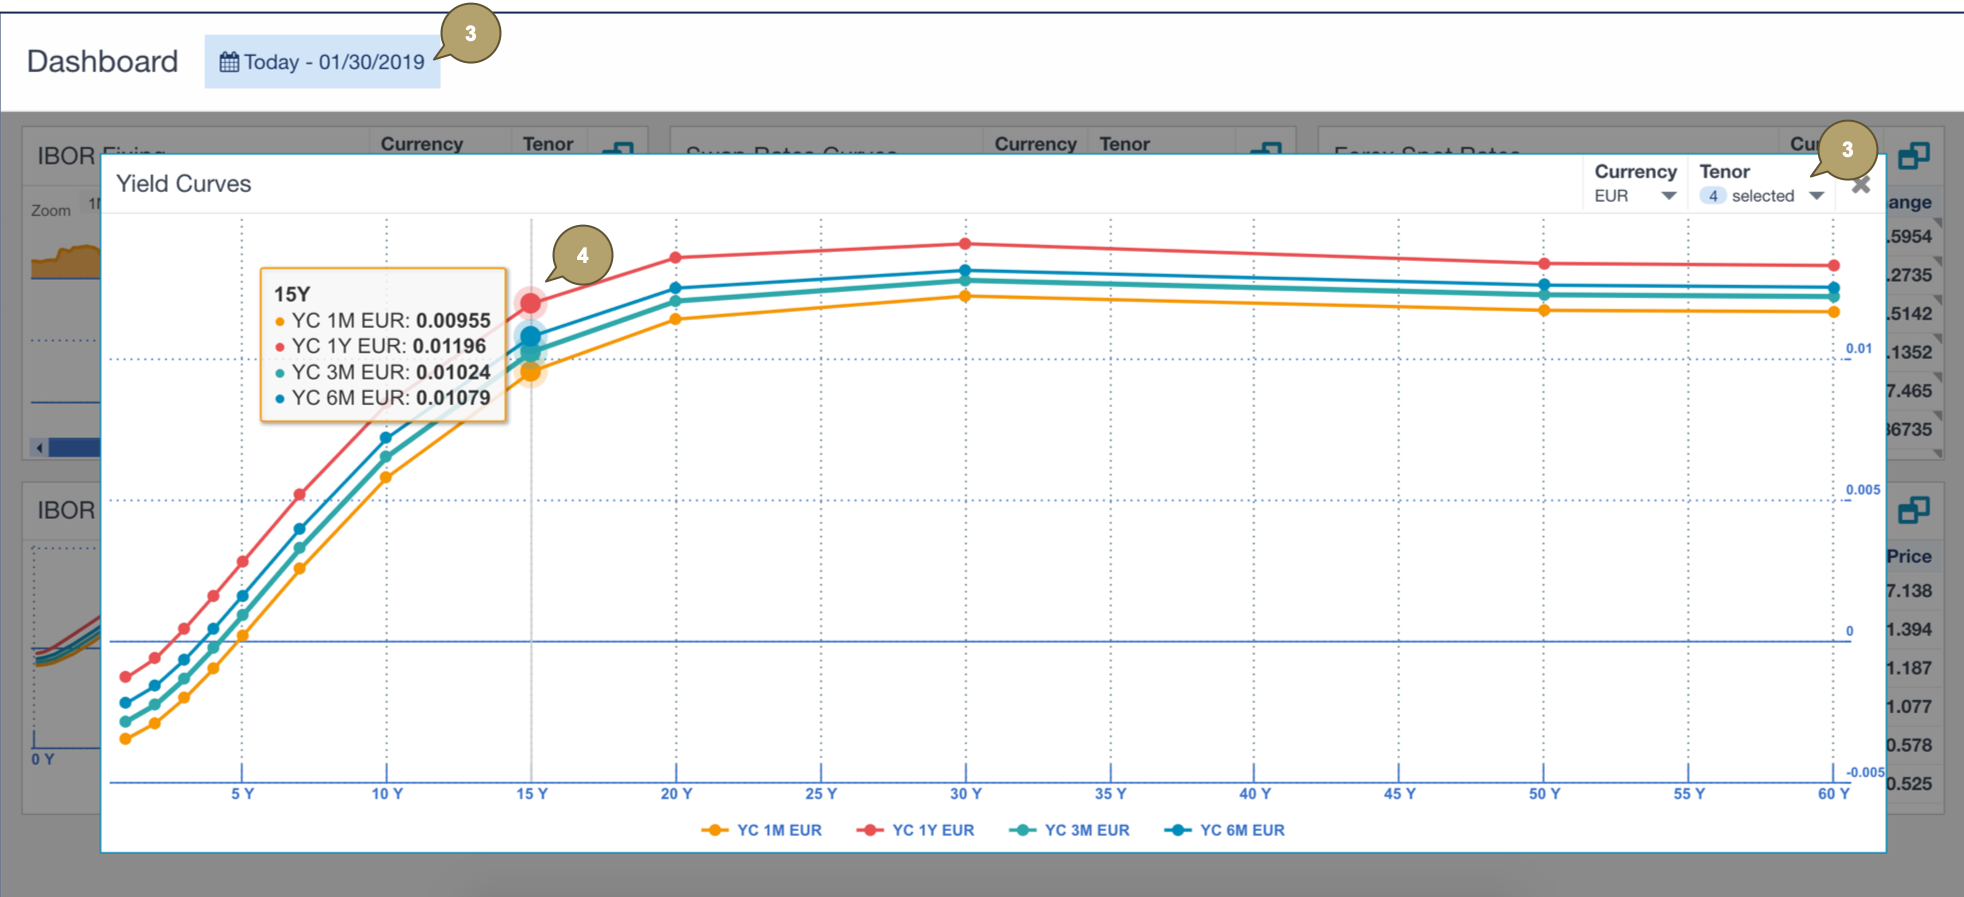
The Yield Curves line graph shows the discount factor of each tenor for a specific currency, on a specific market date.
Navigate to the Market Application
- Log in to your Fairways Debt account.
- Select a customer account.
- Navigate to Applications
 > Market.
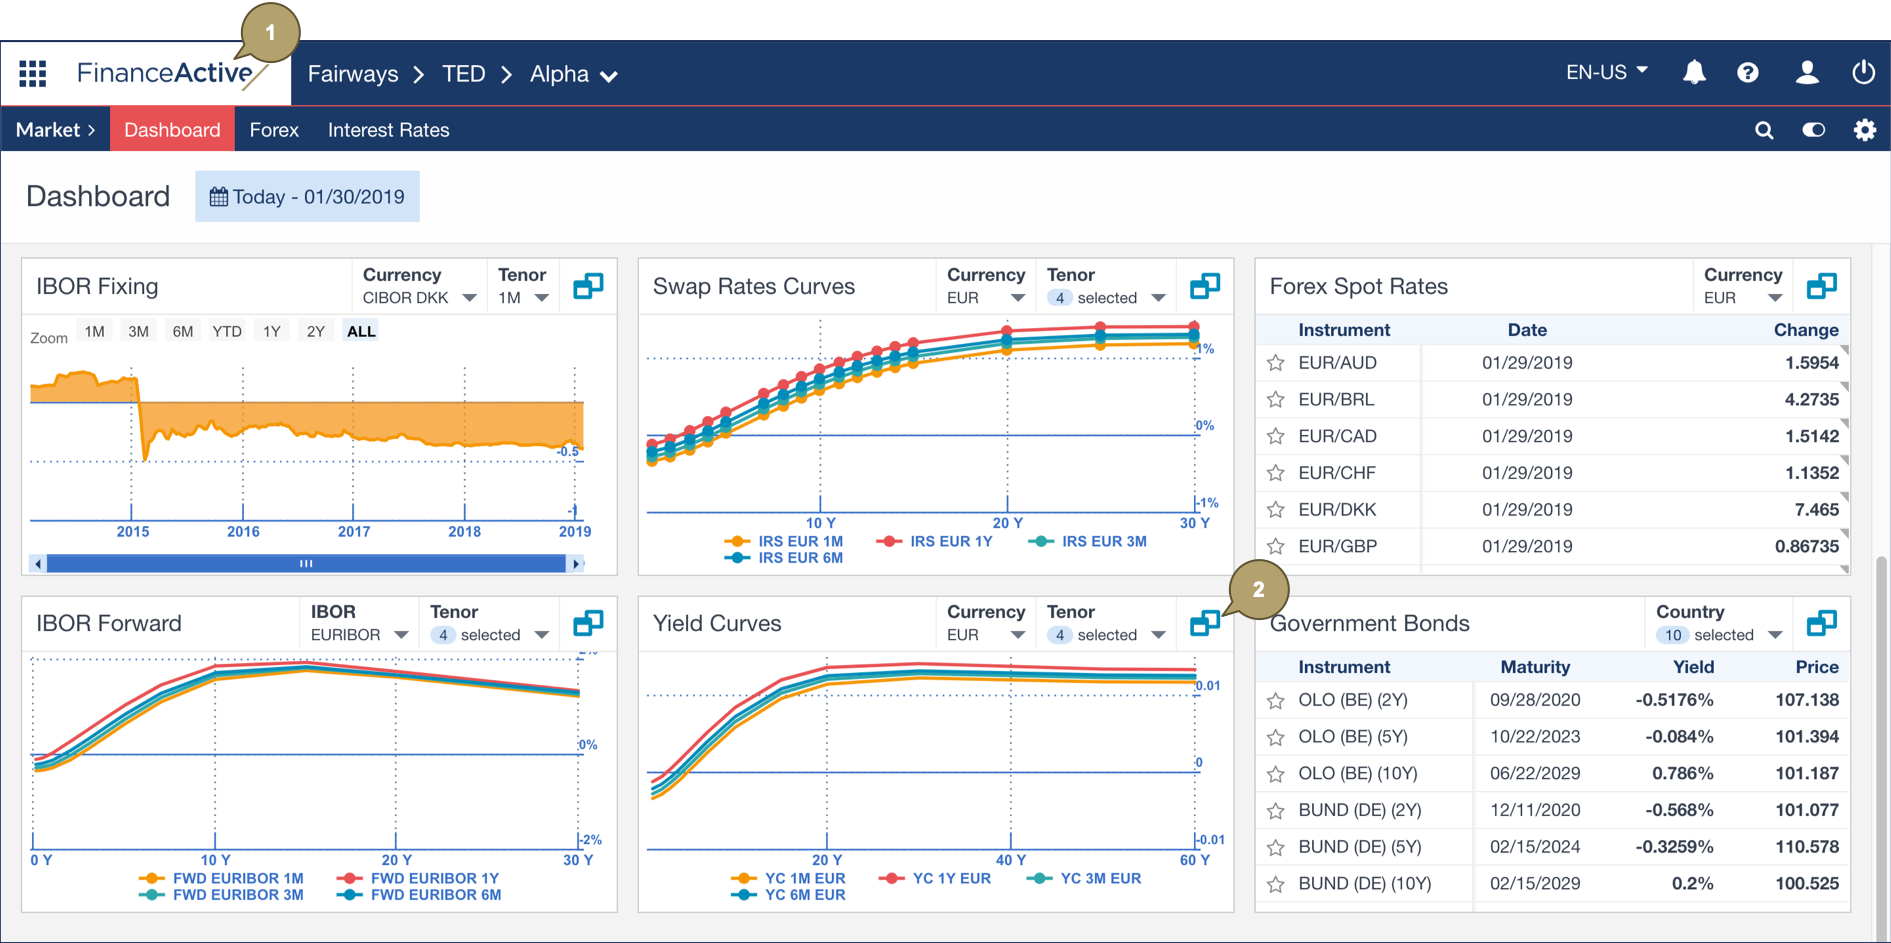
View the Yield Curves Graph
- Navigate to Dashboard.
- Click Enlarge
 beside the Yield Curves panel to display a larger graph.
- Edit the market date, currency and tenor(s) to display relevant data.
- Hover over a marker to display the accurate discount factor(s).
Related Documentation