Analytics is a module, contact your Finance Active consultant for more details.
Analyze Your Debt Using Smart Analytics Indicators
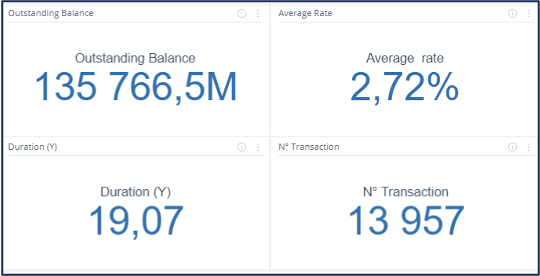
Thanks to the Analytics application, you can monitor your debt and take decisions using smart analytics key indicators:
- View key indicators based on your whole portfolio
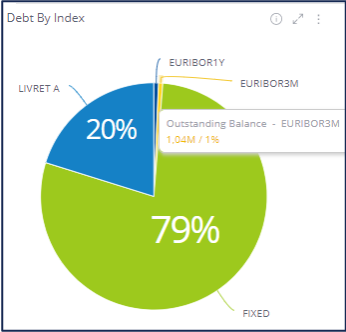
- View analytics broken by transaction characteristics: such as outstanding balance repartition based on indexes
Access Your Prepackaged Dashboards
Dashboards
- Navigate to your prepackaged dashboards
- Jump from one dashboard to another one in one click
- Filter the whole content of your dashboard in one click
Widgets
- Navigate through a list of widgets
- Each widget type offers a specific view of your analytics:
- Indicator widgets highlight numeric strategic analytics
- Table or Pivot show a bulk of data referring to transaction characteristics and analytics indicator
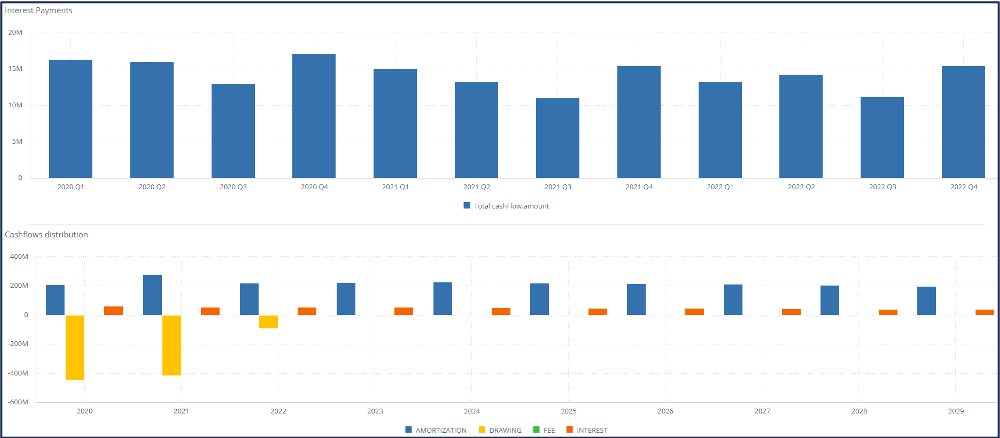
- Bar and Line charts show the trend of the analyses across the time
- Filter the content of a widget in one click
Data Export
- Export your data from a widget to CSV, Excel, PDF, or image format
- Export your data from the whole dashboard to PDF or image format
Access Rights
- Set data access rights for a single user or for a user group
- Set dashboard access rights for a single user or for a user group
Drill Down from a High Level View to a Detailed One
Drill down for a given widget from an aggregated view to a detailed one:
- Monitor the average rate of your whole portfolio
- Drill down to a single cash flow line