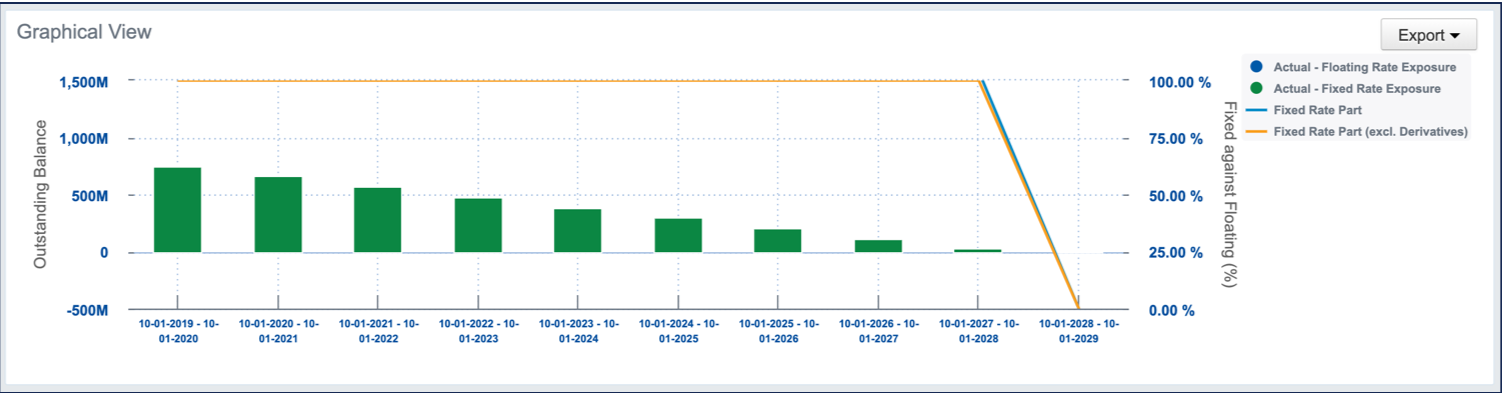
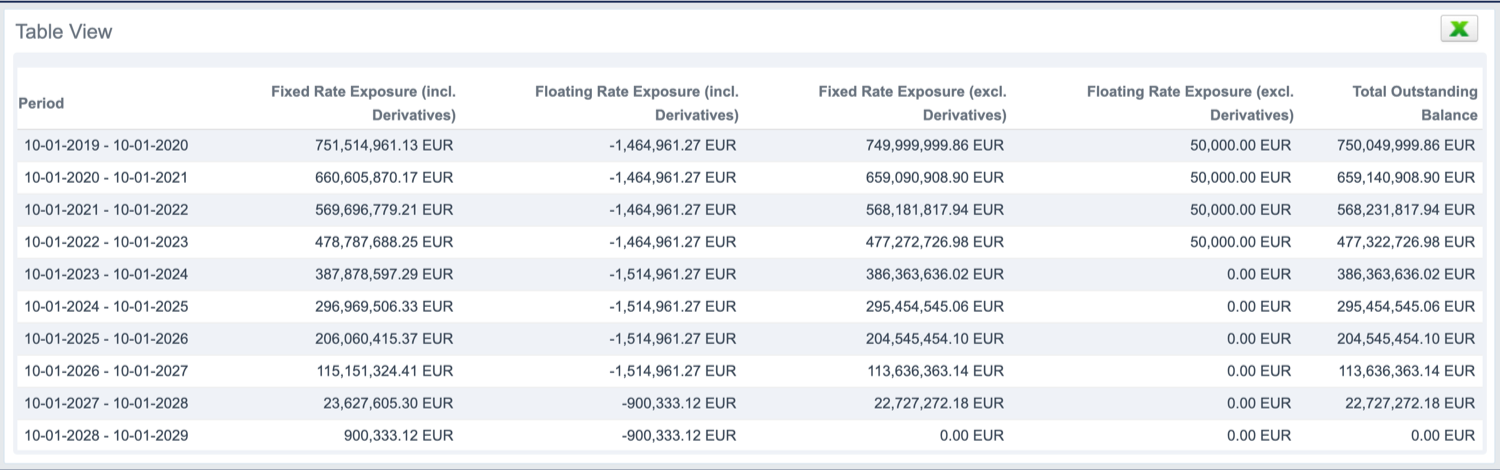
The Fixed/Floating Rate Exposure analysis in Fairways Debt shows how the floating rate debt evolves over time in relation to the fixed-rate debt. The analysis also presents the impact of derivatives on this exposure.
Prerequisite
- Contact your Finance Active consultant to enable the Debt Matutiry Profile analysis in your customer account
Navigate to the Analysis & Reporting Application
- Log in to your Fairways Debt account.
- Select a customer account.
- Navigate to Applications > Analysis & Reporting.
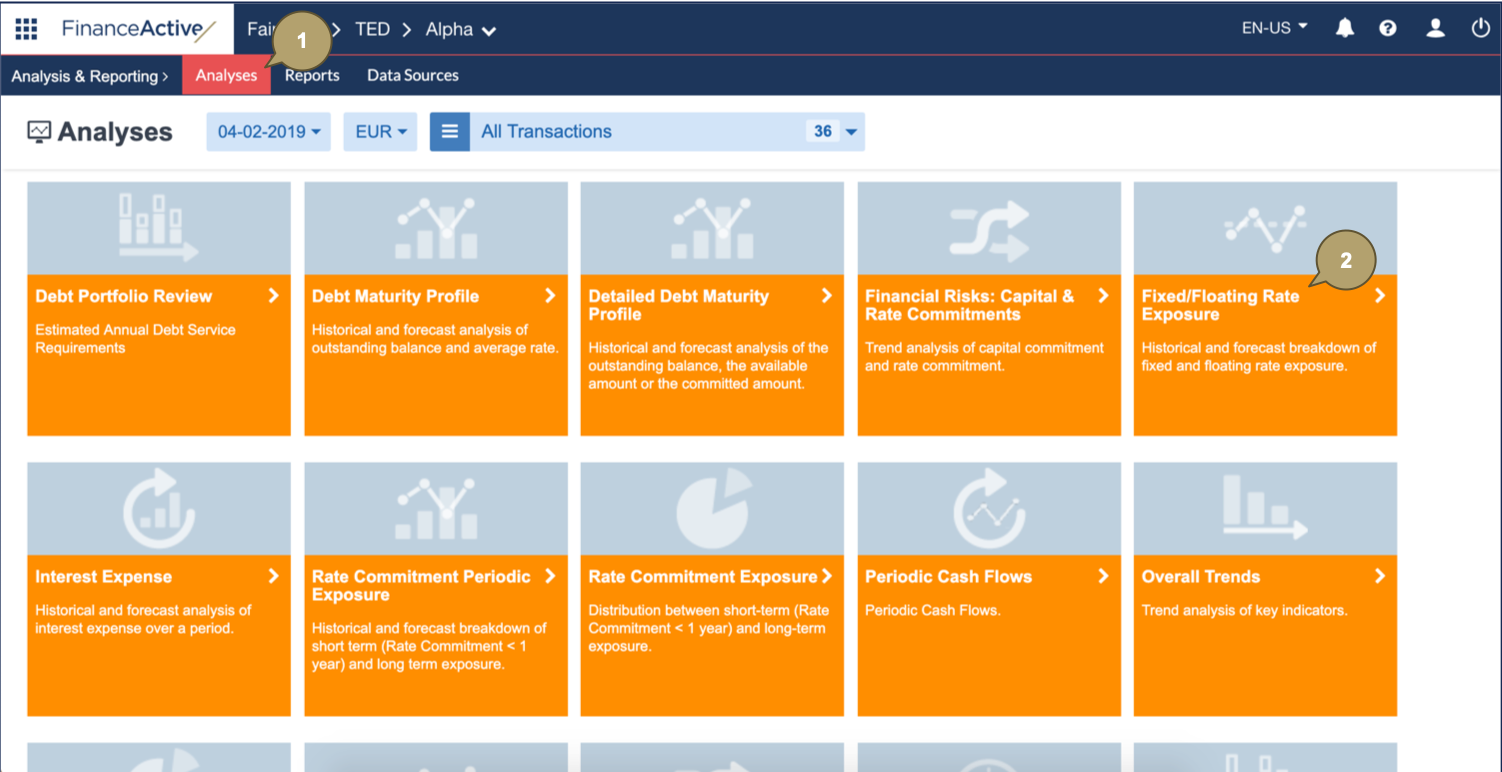
Generate a Fixed/Floating Rate Exposure Analysis
- Navigate to Analyses.
- Click Fixed/Floating Rate Exposure.
- Configure the analysis settings.
|
Field |
Description |
|---|---|
|
Market Date |
Analysis date. |
|
Currency |
Currency in which the analysis data displays. |
|
Filter |
Refine to include relevant data in the analysis. |
|
Display data following a period, start and end dates included. |
|
|
Renewal Policies |
Include/Exclude renewal policies. |
|
Tags for Simulated Portfolio |
Filter by tag(s) applied to the simulated portfolio. |
|
Simulate how data would look based on different values. |
|
|
FX Rate Scenario |
Apply a simulation using custom Forex rates. |
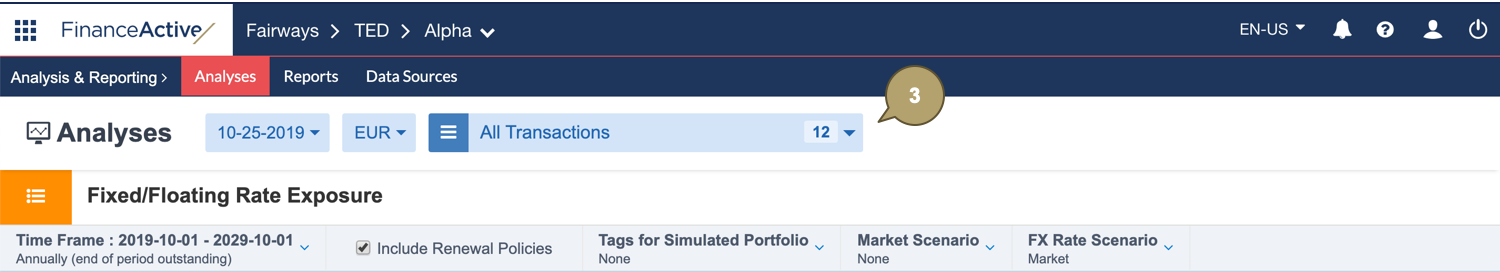
The Fixed/Floating Rate Exposure analysis updates following the selected settings.
Time Display
- Select an analysis type:
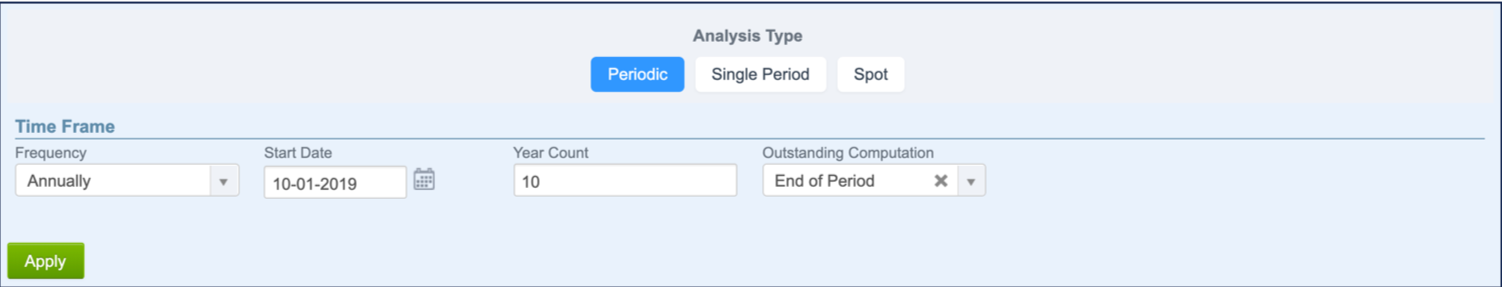
- Periodic: Data of each period for a defined time frame.
|
Field |
Description |
|---|---|
|
Frequency |
Period frequency. |
|
Start Date |
Start date of the period. |
|
Year Count |
Period length. |
|
Outstanding Computation |
Data to compute. |
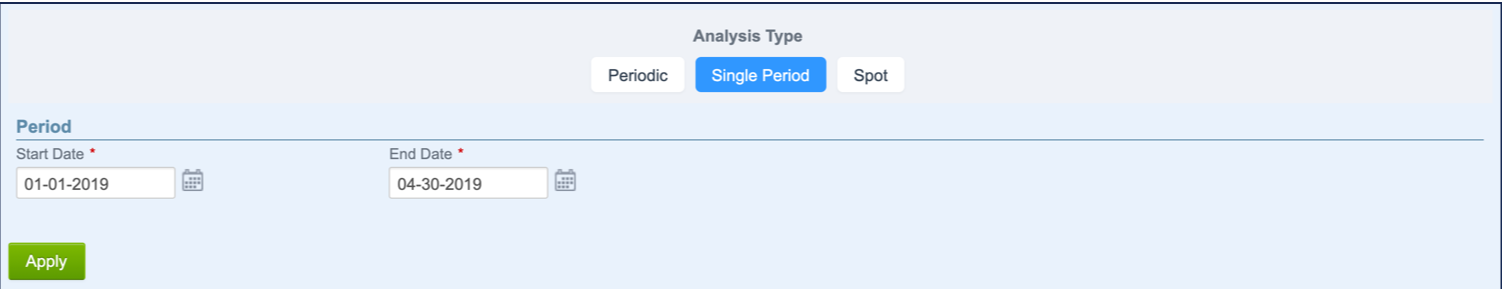
- Single Period: Data summary of the selected period.
|
Field |
Description |
|---|---|
|
Start Date |
Start date (included) of the period. |
|
End Date |
End date (included) of the period. |
- Spot: Data at a specific date.
|
Field |
Description |
|---|---|
|
Spot Date |
Specific date. |
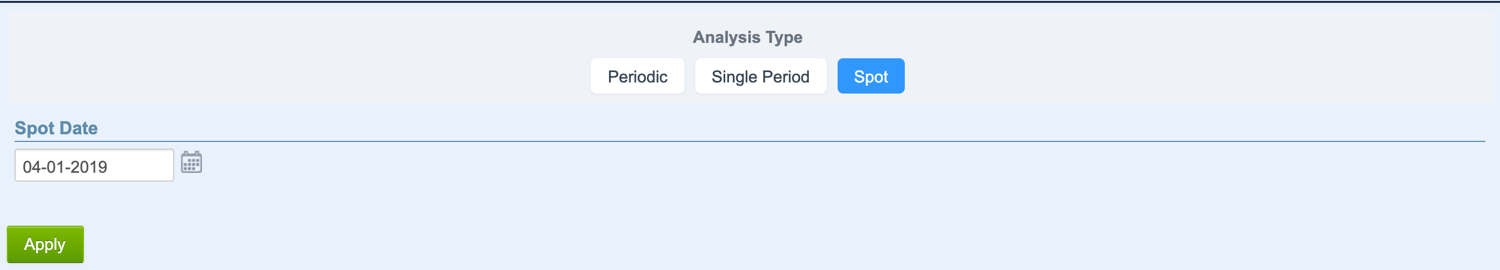
- Click Apply to update the analysis.