Fairways Debt offers a comprehensive environment, enabling you to build and customize template-based reports.
A report is a set of predefined settings used to export a user-specific table, where all the transactions or cash flows in the current portfolio display in groups, aggregated indicators, and any number of columns.
Periodic reports display a series of periods. You define the start and end dates, and the frequency of the periods.
Navigate to the Analysis & Reporting Application
- Log in to your Fairways Debt account and select a customer account and an organization, if relevant.
- Navigate to Applications
 > Analysis & Reporting.

Create a Periodic Report
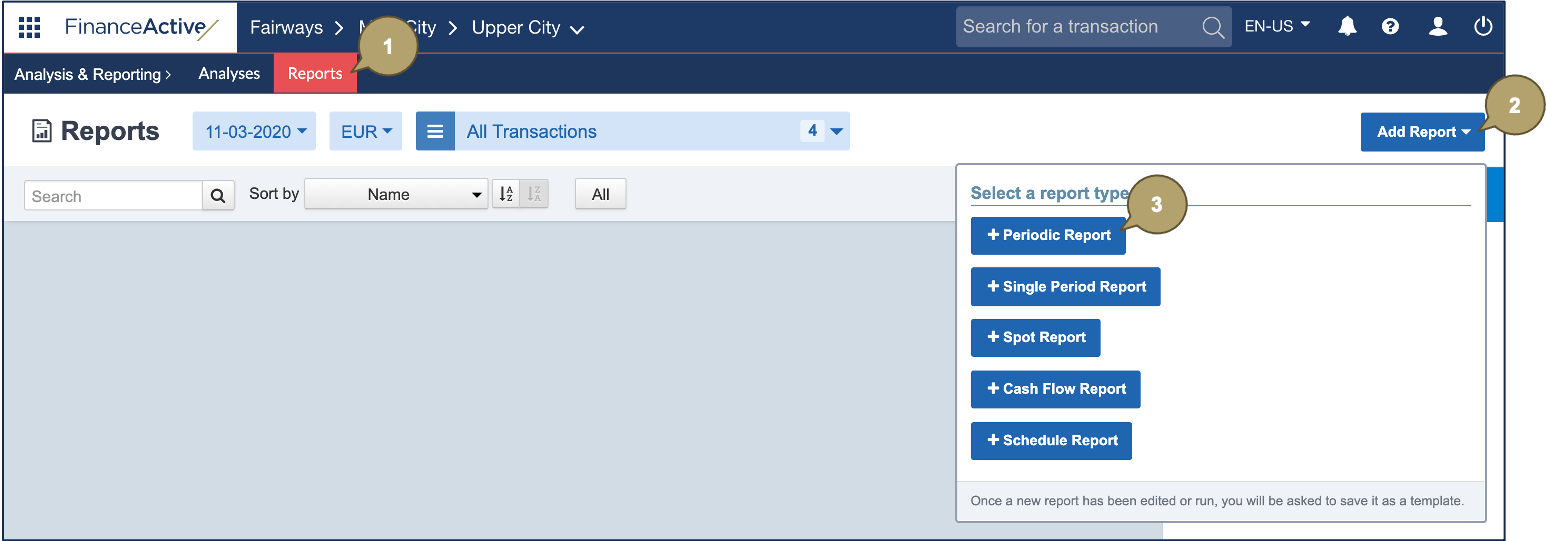
- Navigate to Reports.
- Click Add Report.
- Click Periodic Report.
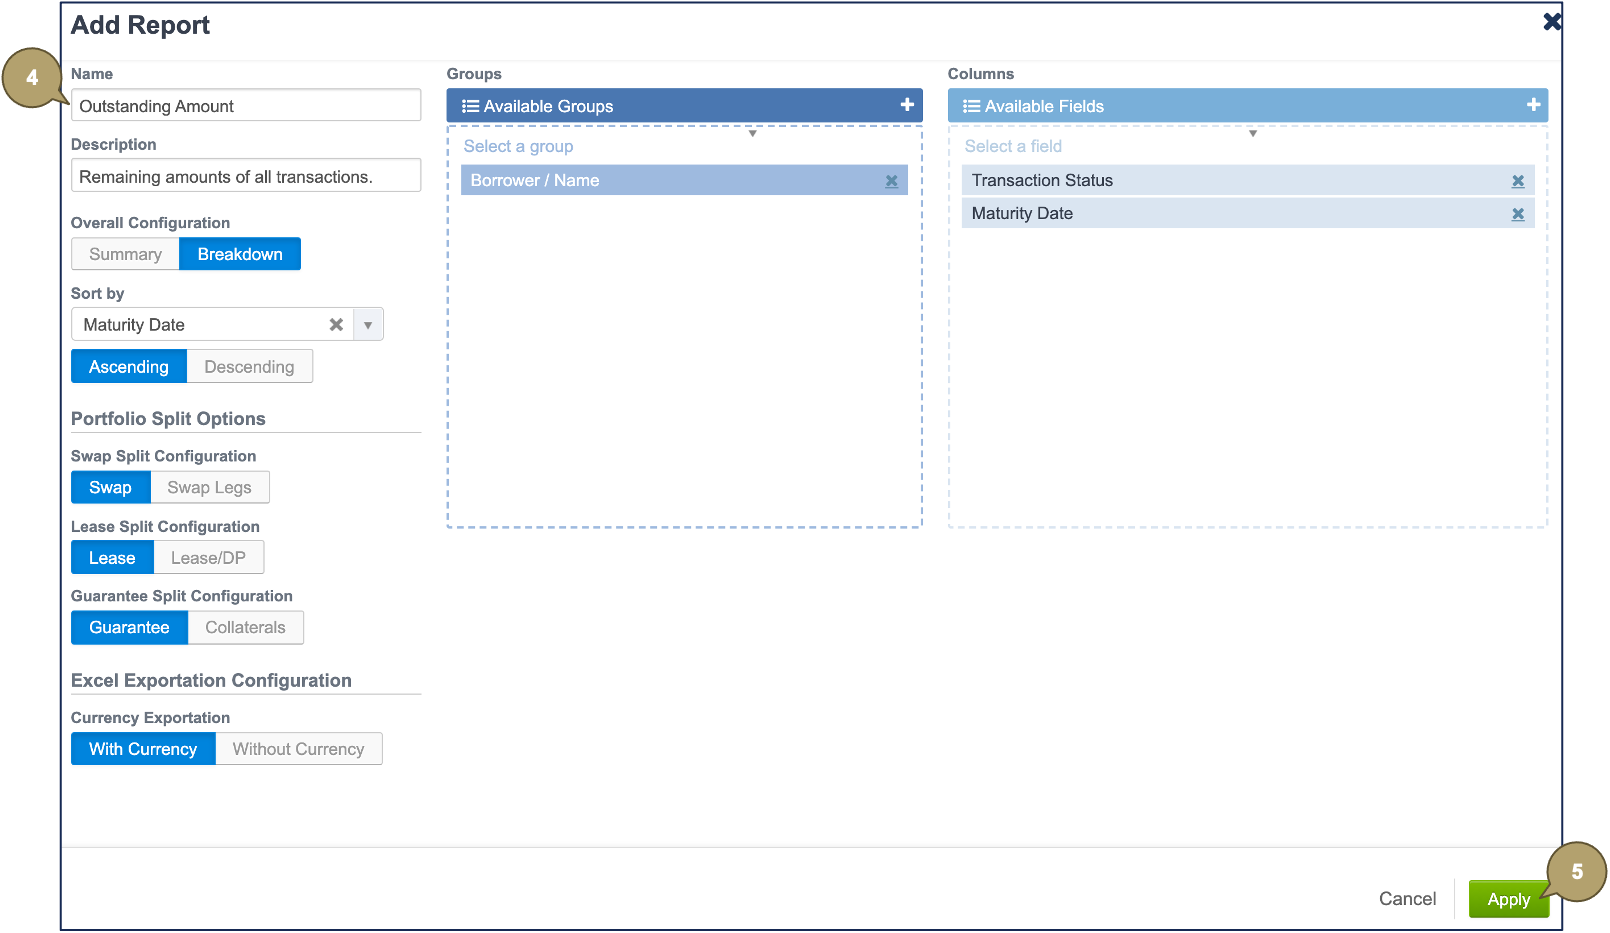
- Complete the form with all relevant details.
|
Field |
Description |
|---|---|
|
Name |
Report name. |
|
Description |
Additional details about the report.
|
|
Overall Configuration |
How transactions display:
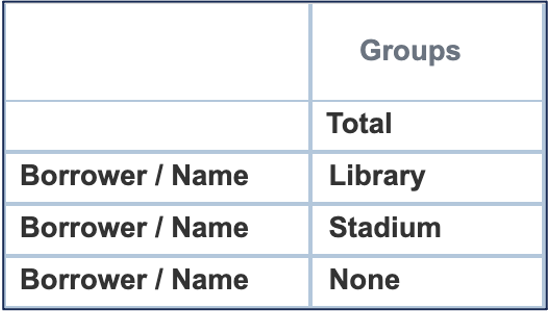
In this example, groups display by borrower name.
|
|
Data display:
|
|
|
Sort by |
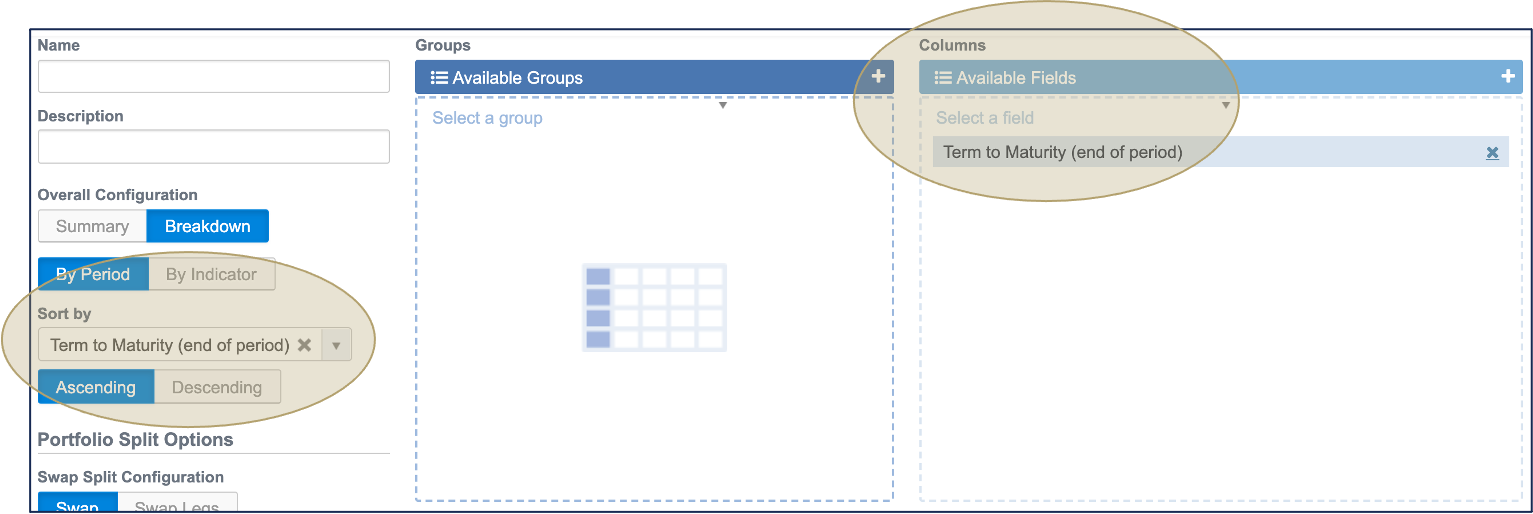
Select an item among the Columns items to sort the transactions by that item. In this example, the transactions are sorted by term to maturity in ascending order.
|
|
Swap Split Configuration |
Display swaps:
|
|
Lease Split Configuration |
Display financial leases:
|
|
Guarantee Split Configuration |
Display guarantees:
|
|
Currency Exportation |
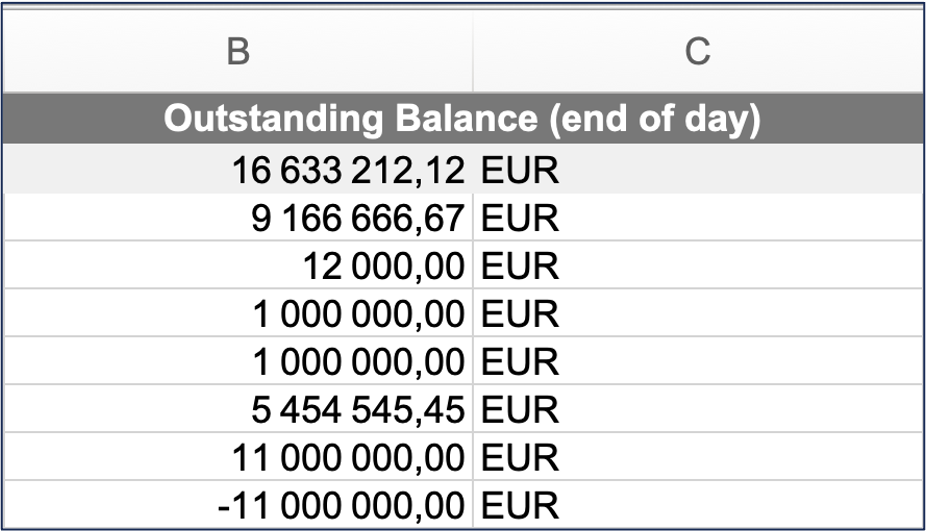
When exporting data to Excel:
|
|
Groups |
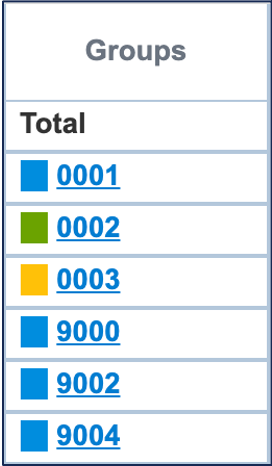
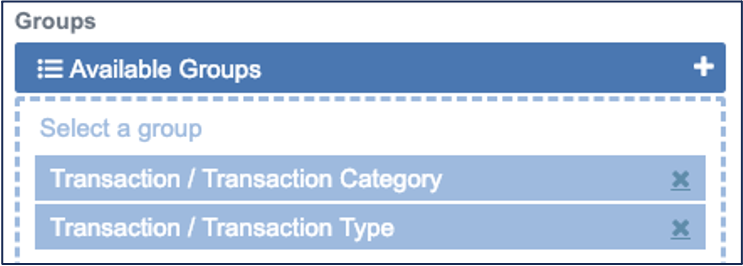
Group transactions using selected items. The first item is the main group, the following items are subgroups. In this example, the first level is Transaction Category and the second level is Transaction Type, i.e. Transaction Type is the subgroup of Transaction Category.
|
|
Columns |
Order items to display from left to right.
|
- Click Apply to create the report.
The report displays in the Reports list.


